K–12 Climate Intelligence

Every voice in your district, heard and acted on.

Cognitive Education runs the surveys, surfaces the climate data across six research-validated domains, and puts board-ready intelligence in front of every campus and district leader, in real time, in English and Spanish, FERPA-first.

FERPA-first · built for districts Families · Students · Staff
app.cognitiveeducation.org/dashboard/district
District dashboard showing six domain scorecards
AI Insights · nightly
0%
Belonging & Wellbeing · favorable
Built for everyone in the building

One ecosystem. Every voice that shapes a school.

Families, students, and staff each get an instrument built for them: age-appropriate, role-aware, and scored on the same trusted scale so leaders can compare like with like.

Families get a single, bilingual survey per campus.

One clear instrument, no logins, no jargon. Delivered in English and Spanish so every household can respond in the language they live in.

  • Measures all six domains, from Safe & Supportive Environment to Inclusion & Family Voice
  • Responses are anonymized, with no PII stored alongside answers
  • Compared side-by-side with student perception in Family vs. Student view
EnglishEspañol1 per campus
FSCFamily & School Communication
How clearly the campus keeps families informed
IFVInclusion & Family Voice
Whether families feel welcomed and heard
SSESafe & Supportive Environment
Physical and emotional safety on campus

Students answer instruments built for their grade band.

Reading level, scale type, and item wording all shift by age, so a second-grader and a senior each get questions that actually fit.

  • Smiley scales for the youngest learners, agreement scales by high school
  • Discipline-fairness items always reportable by race & ethnicity
  • Belonging and wellbeing tracked from elementary through graduation
Age-appropriateEN · ES
K–5Elementary
Smiley & yes/no scales · short instrument
6–8Middle School
Agreement scales · belonging focus
9–12High School
Full instrument · future-readiness items

Staff climate, on a two-track instrument.

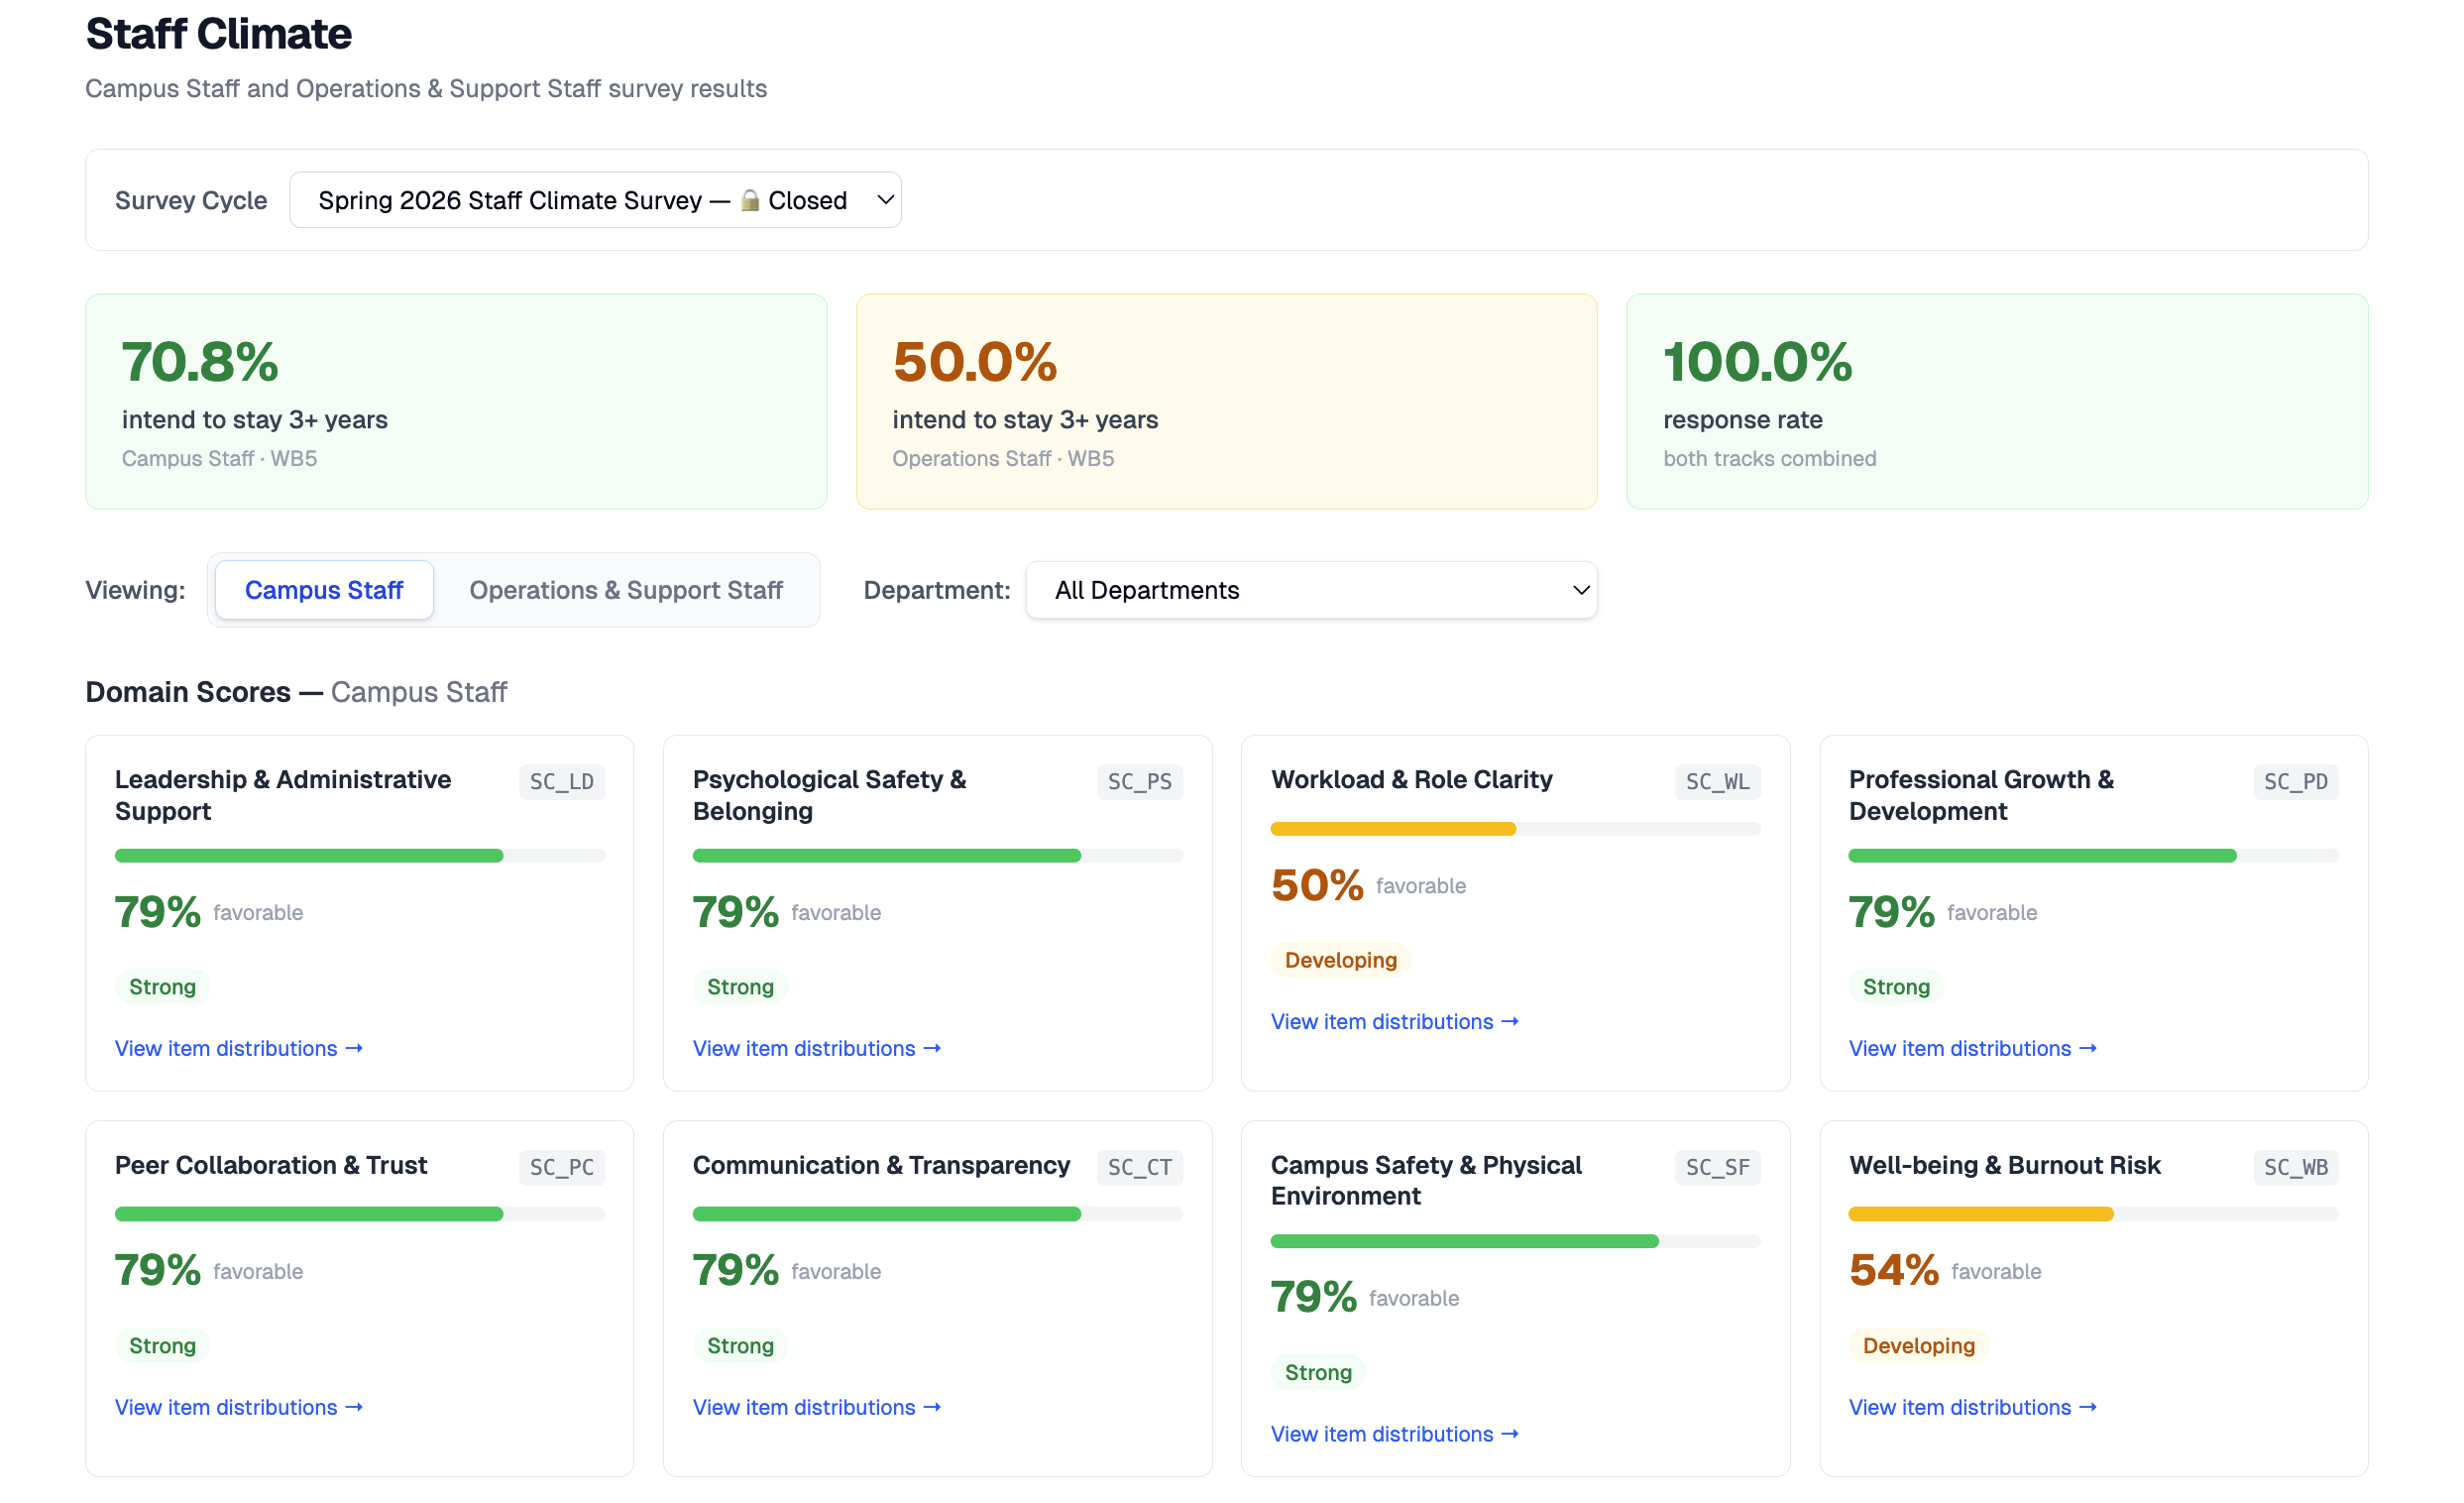
Campus staff and operations & support staff each answer questions tuned to their role, then roll up into eight staff-climate domains and a retention signal.

  • Tracks Leadership Support, Psychological Safety, workload & burnout risk
  • Surfaces retention intent: who plans to stay three-plus years
  • Department-level filtering for targeted human-capital decisions
Campus trackOperations track
Campus Staff
0%
intend to stay 3+ years
Response rate
0%
both tracks combined
SC_WBWell-being & Burnout Risk
An early-warning signal for every campus
The instrument

Six domains, grounded in peer-reviewed research.

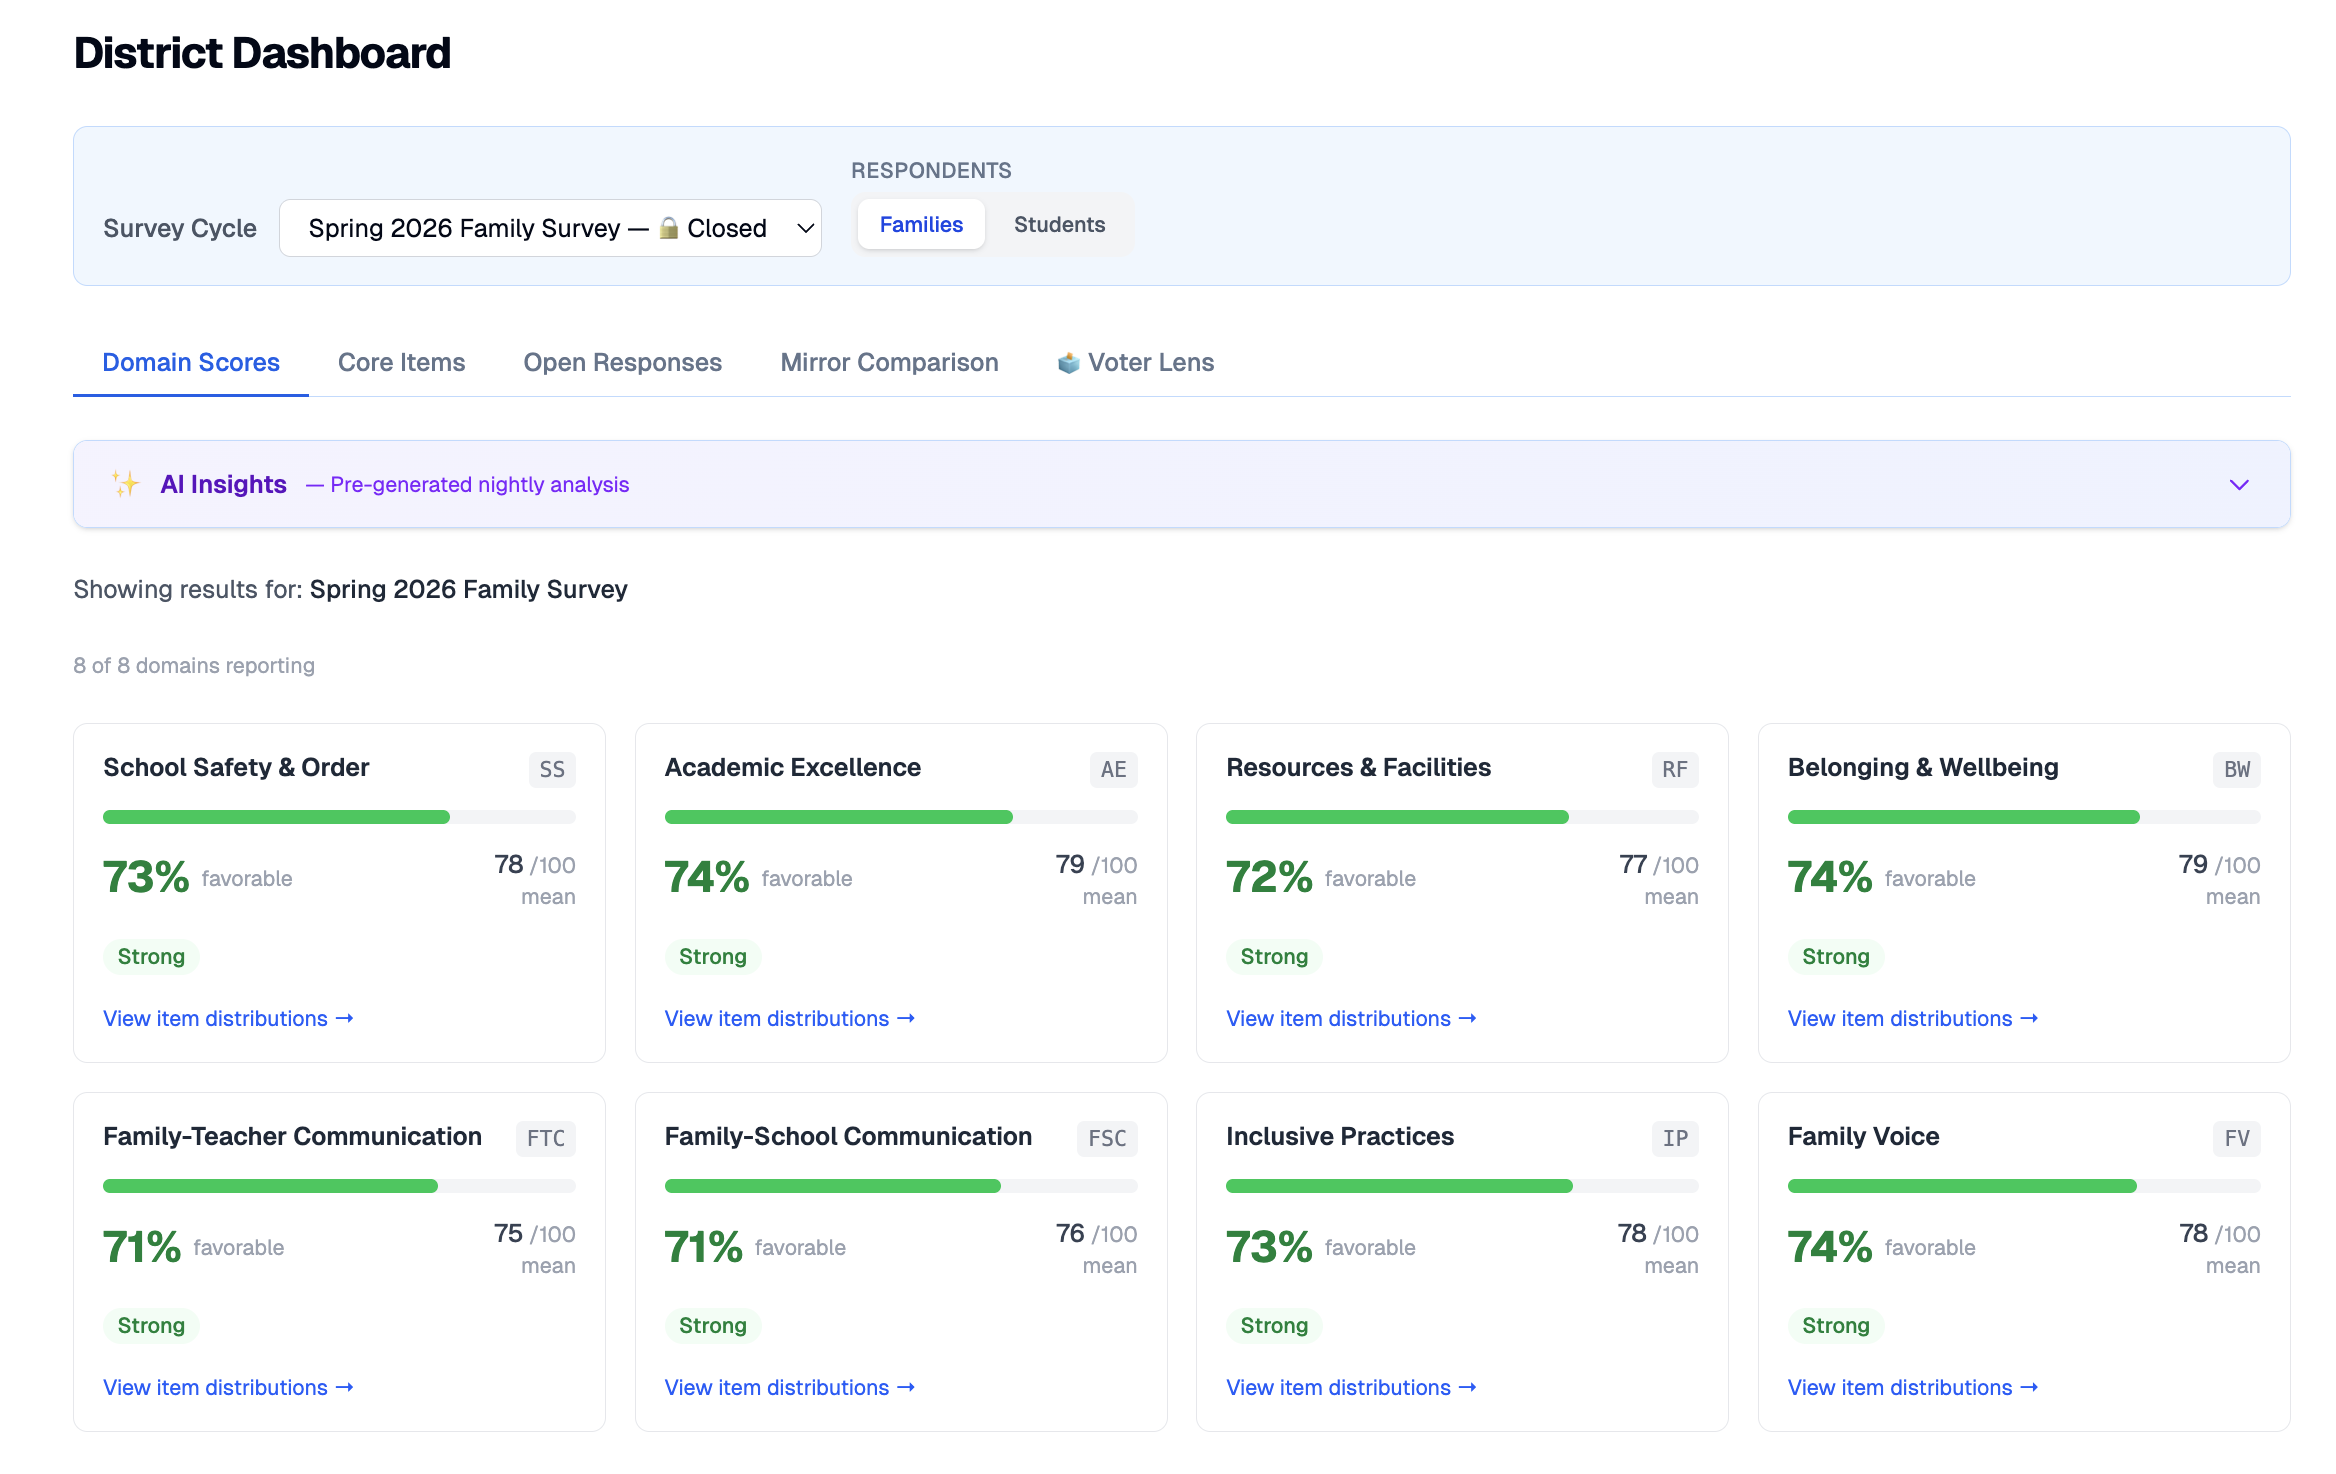
Every item maps to one of six domains of school quality. Scores below show a real district cycle; favorability bars animate as you scroll.

Safe & Supportive EnvironmentSSE
73%favorable · 78 / 100 mean
Academic Quality & SupportAQS
74%favorable · 79 / 100 mean
Learning Environment & ResourcesLER
72%favorable · 77 / 100 mean
Student Belonging & WellnessSBW
74%favorable · 79 / 100 mean
Family & School CommunicationFSC
71%favorable · 76 / 100 mean
Inclusion & Family VoiceIFV
73%favorable · 78 / 100 mean
Plus a parallel eight-domain staff-climate instrument, and Entry & Exit surveys for new and departing community members.
Inside the dashboard

The whole picture, without leaving the page.

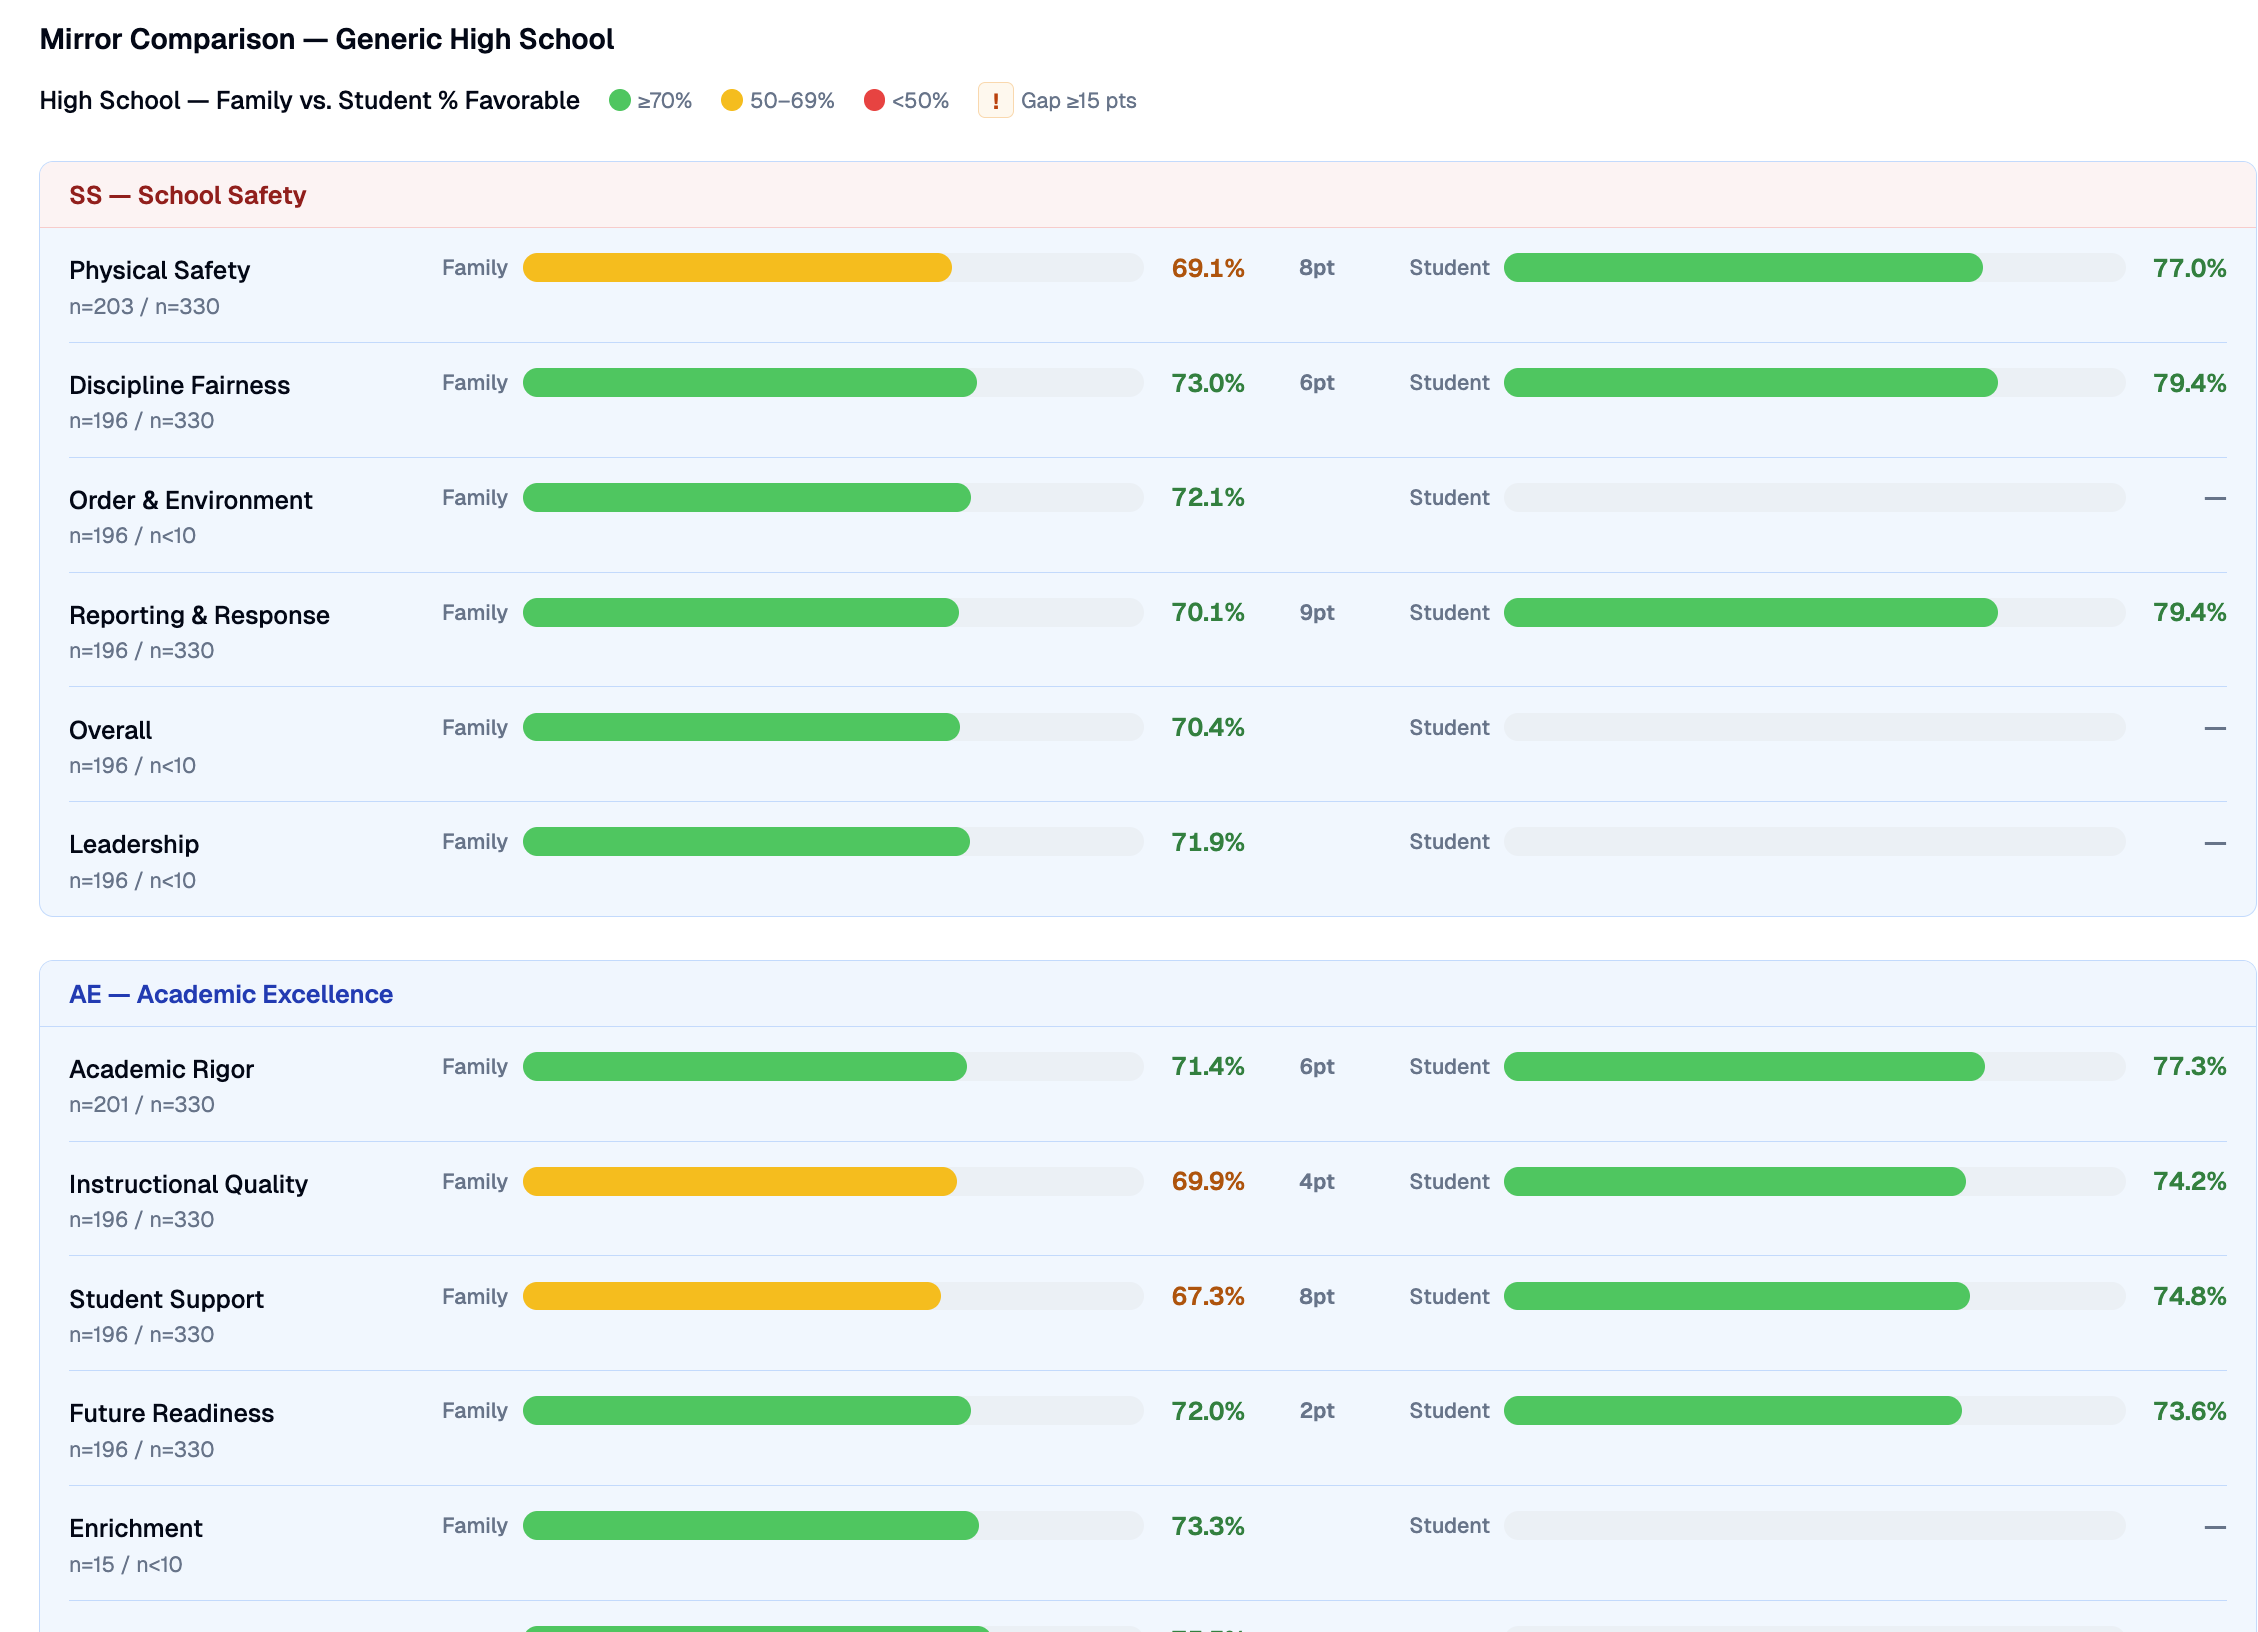
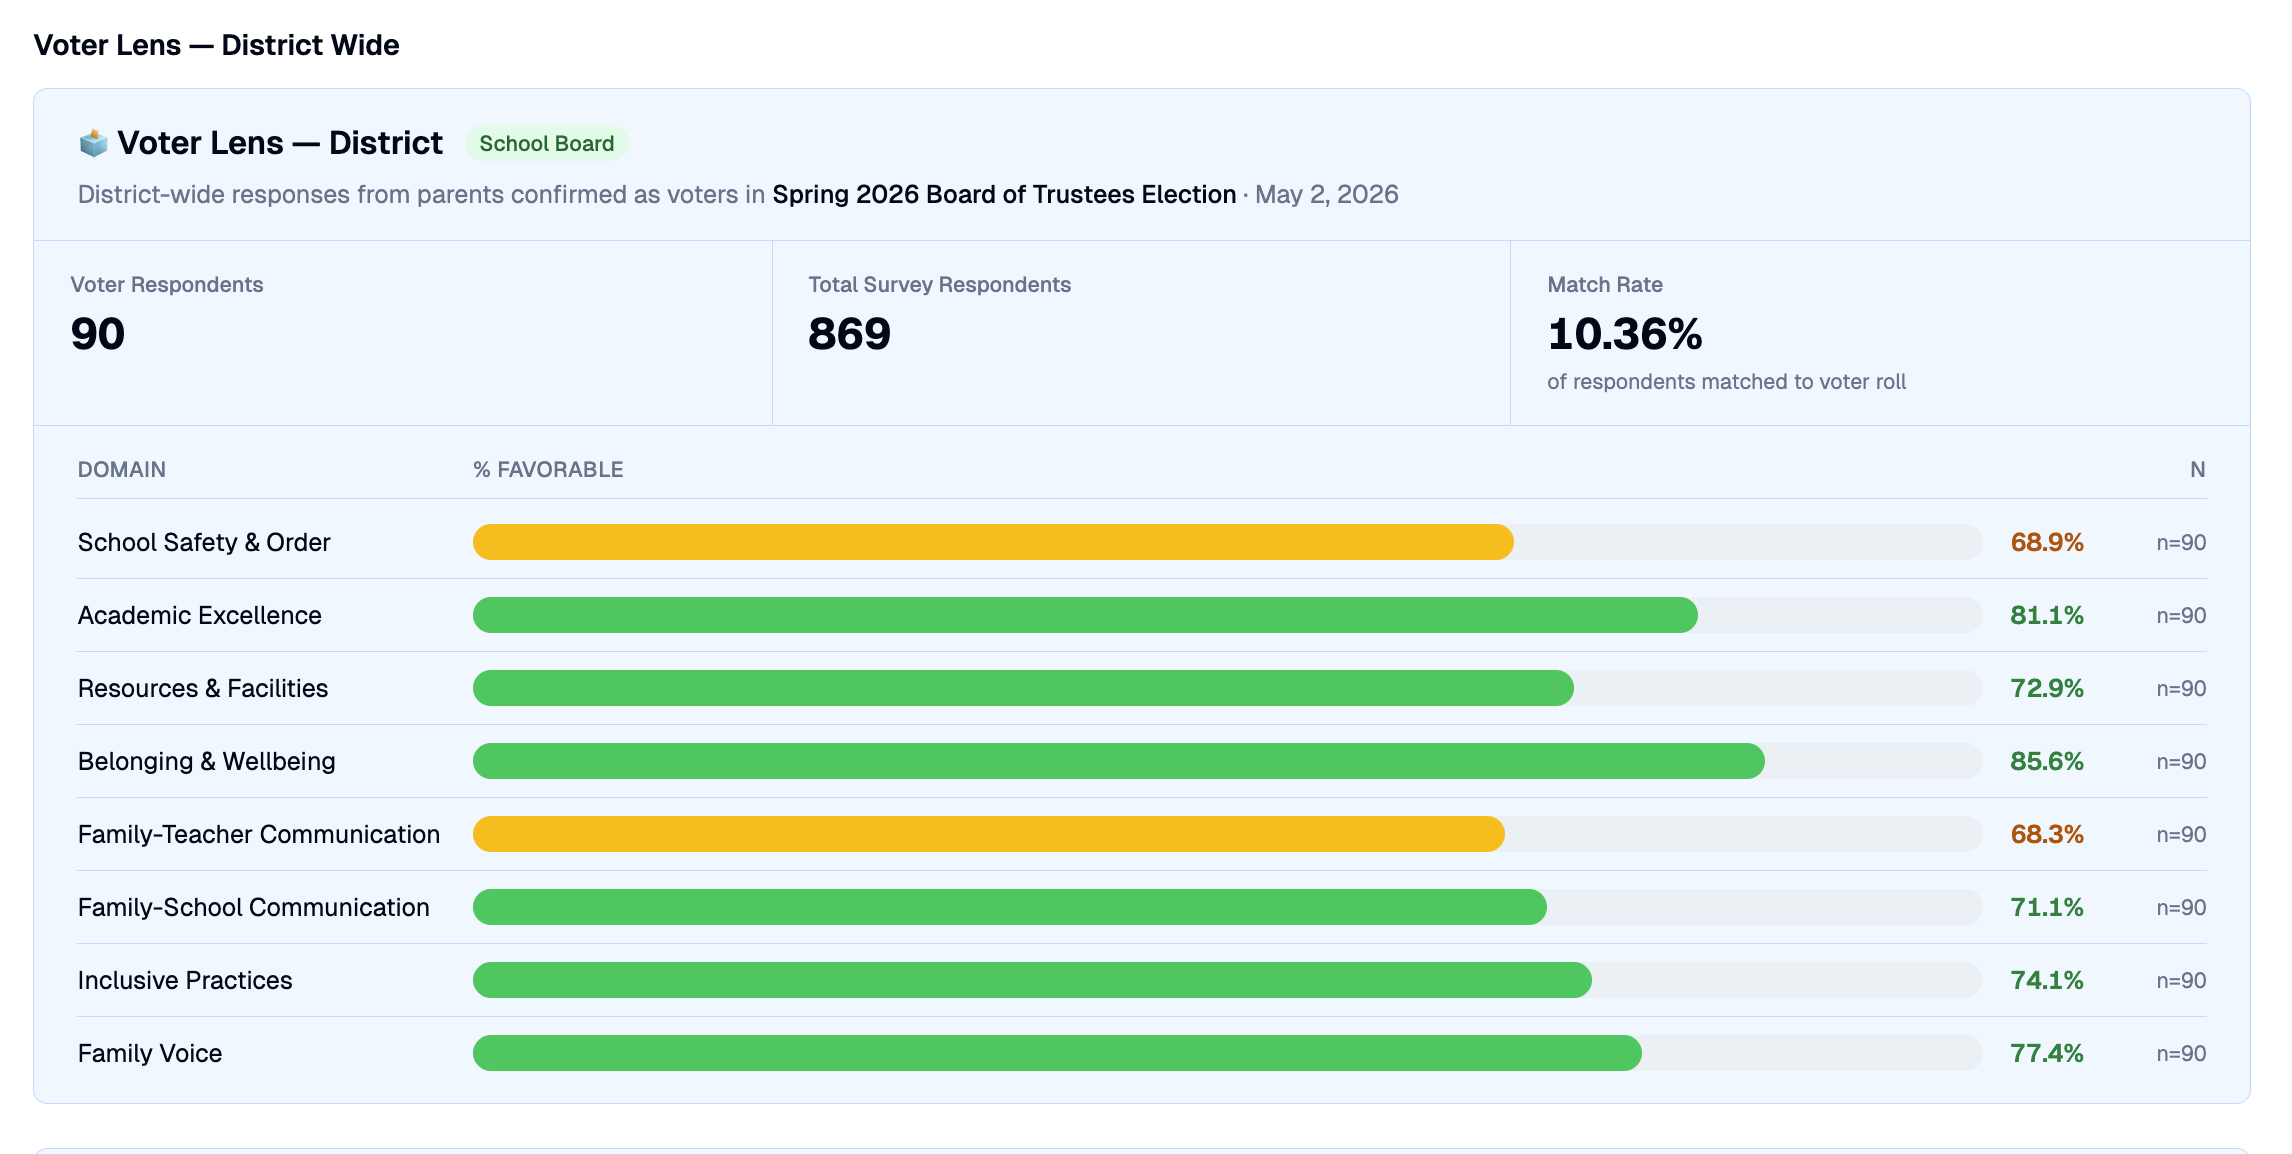
Domain scores, family-vs-student gaps, staff climate, event-triggered entry & exit surveys, and an optional voter-roll lens. Switch between the real views administrators use every day.

district dashboard · domain scores
Domain scorecards
Real-time Six scorecards with favorability %, mean score and strength band.
district dashboard · mirror comparison
Family vs student mirror comparison
Equity Family and student perception side-by-side; gaps of 15+ points flagged automatically.
district dashboard · staff climate
Staff climate dashboard
Retention Campus and operations tracks, with intent-to-stay and burnout signals.
district dashboard · entry & exit report
Entry & Exit Report
EE-ENTRYEmployee Entry EE-EXIT SF-ENTRY SF-EXIT
Surveys Completed
312
of 358 invited
Response Rate
87%
completions ÷ invited
Avg Satisfaction
82
out of 100
eNPS Score
+41
−100 to +100

Domain Scores

Average normalized score (0–100) across agreement & satisfaction items.

EE_ORIOrientation & Onboarding84
EE_CLTCulture & Belonging81
EE_RLERole Clarity & Expectations79

eNPS Breakdown

New-hire net promoter, first 90 days.

54%33%13%
Promoters 168
Passives 103
Detractors 41
Event-triggered Four instruments (employee entry & exit, student/family enrollment & withdrawal) deploy automatically on hire, attendance, and separation events.
district dashboard · voter lens
Voter lens analysis
Optional module Match engaged families against the voter roll for community-engagement strategy.

Pilot it on one campus.

Start with a single campus cycle and a live district dashboard. We handle the instruments and the languages so your team can focus on what the data reveals.

Start a pilot Take the product tour
No PII required to evaluate · FERPA-first by design